EFJ survey reveals precarious working conditions of journalists working for digital media in Europe

What kind of conditions, such as contracts or salaries are online journalists working under? Are they satisfied with their jobs? What needs to be improved and what role can the union play to enhance the working conditions of journalists in digital media? The European Federation of Journalists (EFJ) has launched a survey aiming to get a better overview of their working conditions and ways to protect their interests through unions/associations.The survey reveals a dangerous trend where many online journalists face precarious working conditions. Among the 231 respondents, 62% said they worked overtime and over 50% of them do not have a full-time employment contract. Nevertheless, 45% are satisfied with their jobs (22% neutral and 33% unsatisfied).
Last Thursday, the EFJ organised a meeting with the EFJ Expert Group on Digital Media (EGDM). Among other topics, the members discussed the results of the survey “How do European online journalists work?” conducted by the EFJ two month ago. Below is a snap shot of the survey results.
1) Profile of the respondents
A. In which country do they work?
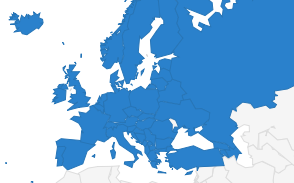
198 journalists have responded. They work in the following countries:

There are no respondents from Azerbaijan, Bosnia-Herzegovina, Bulgaria, Croatia, Cyprus, Czech Republic, Estonia, Faroe Islands, Georgia, Iceland, Latvia, Luxemburg, Montenegro, Poland, Russia, Serbia, Slovakia, Slovenia, Switzerland, Turkey and Ukraine.
Among them, 81% are members of an union or a professional association of journalists. This high percentage can be explained by the fact that the survey is distributed from the EFJ to its member organisations at national level.
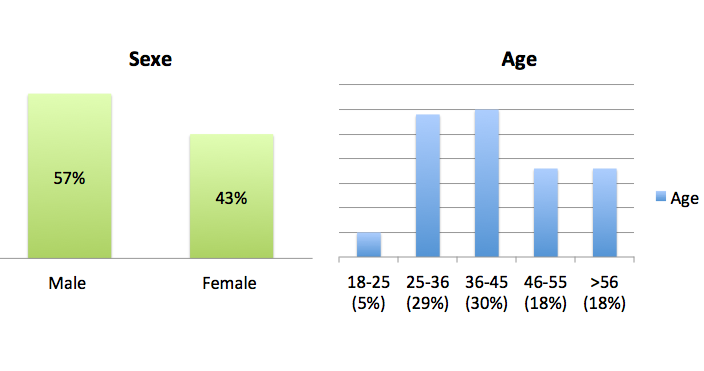
B. Gender & Age
57 % of the respondents are male, 43% are female. 60% of the respondents are between 26 and 45 years old. Only 5% are younger (between 18-25).
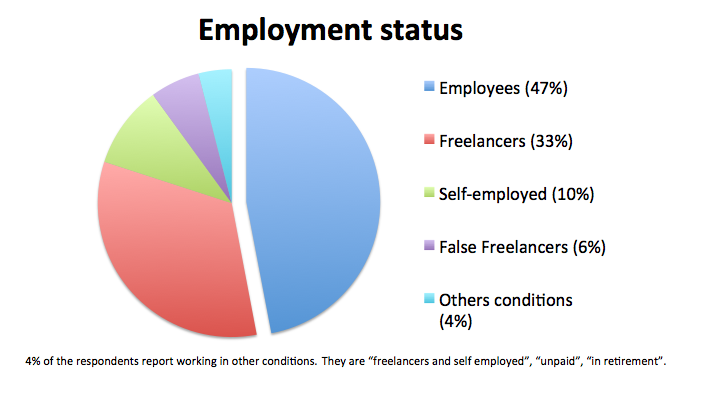
C. What is their employment status?
47% are employees, 33 % work as freelancers, 10% are self-employed, 6% are “false freelancers”. 4% of the respondents classified themselves in other conditions.
D. Do they work for both traditional and digital media or only for digital media?
63% of the respondents work for both traditional and digital media. Among them, 44% say that they work more for traditional media than digital media, 22% work equal time for each media and 34% work more for digital media than traditional.
2) Job content
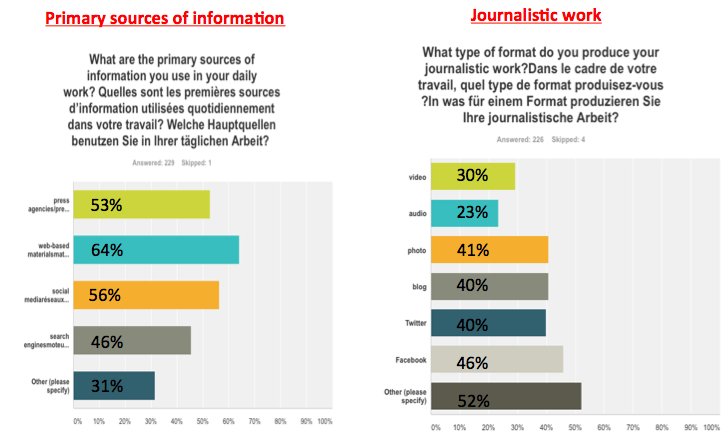
E. Primary sources of information & Journalistic work
64% of the respondents considered web-based materials as their primary sources of information. Next comes to social media (56%), press agencies (53%), search engines (45%). 31% of the respondents reported to use “others” sources. 28 respondents mentioned interviews (personal contacts) and 14 cited traditional media as their primary sources of information. Almost half of the respondents (46%) produce ”Facebook format”. 41% produce photo, blog and Twitter contents. The majority of the respondents (52%) said they produced “others” types of format.
3) Working conditions
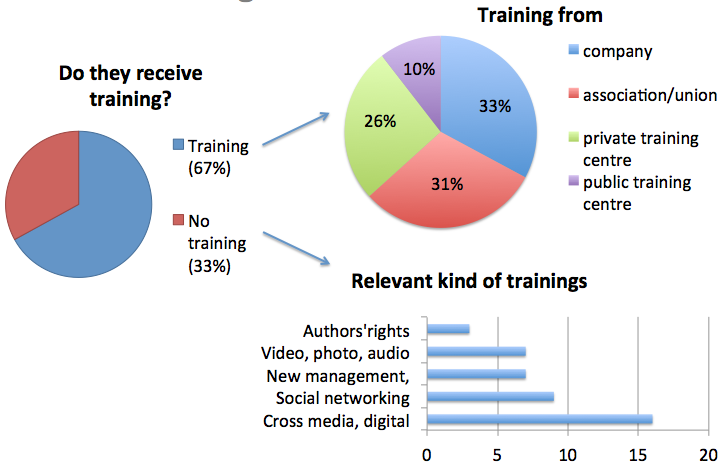
F. Training
The majority of the respondents (nearly 70%) receive training. Among them, a third received said that they received their training from the company they work for while another third received training from unions or associations. Respondents who don’t receive training expressed interests in training on: cross media, digital platforms & data journalism, social networking, news forms of management, video-photo-audio and authors ‘rights.
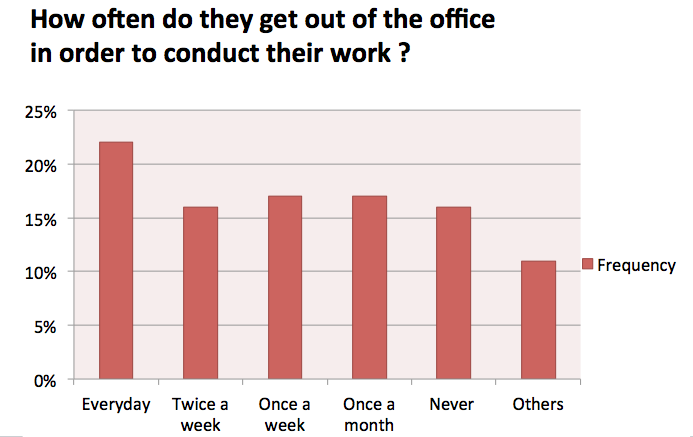
G. Active or sedentary work
22% of the respondents said they work outside of the office everyday while 16% said they never get out. The sector seems to cover many different realities.
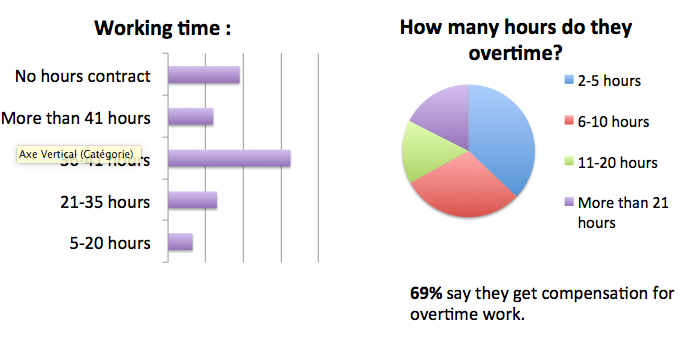
H. Working time
The majority of the respondents work between 36 and 41 hours. When they do overtime, 37% of worked 2 hours over time, 30% worked 6-10 hours overtime, 15 % worked between 11 and 20 hours over time and 18% worked more than 21 hours over time. 69% of the respondents get compensation for overtime.
I. Social media and online presence
61% of the respondents said that a social media and online presence was required as part of their job. Among them, 35% receive specified targets:
- Audience (clicks, followers, etc.): 42%
- Posts: 28%
- Sharing (re-tweet, etc.): 19%
- Others: quality, relations with influent persons, etc.
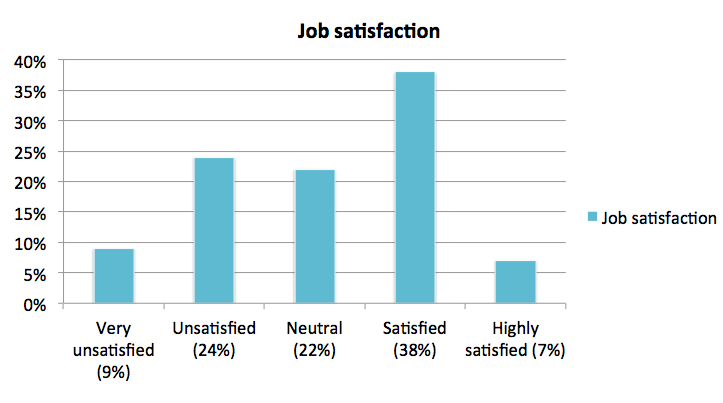
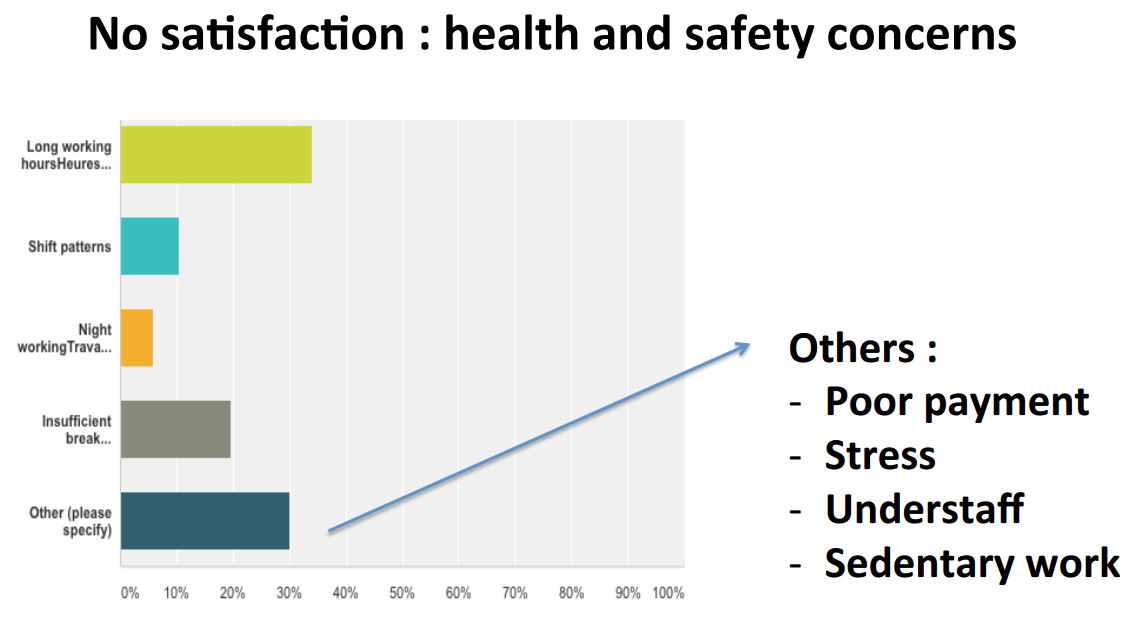
J. Job satisfaction
45% of the respondents said they are satisfied or highly satisfied with their jobs. A third said to be unsatisfied or very unsatisfied of their jobs.
4) Relations with professional associations & unions
K. 81% are members of an union or a professional association of journalists. This high percentage can be explained by the sharing context of the survey.
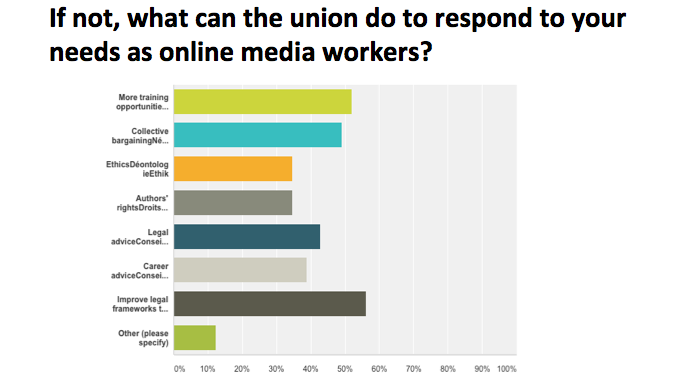
48% of the respondents mentioned an Union representation in the work place. Among them, 54% of the respondents consider that their union takes up the issues of digital workers.
In order to make the survey more representative, the online questionnaire is still open for respondents. Please circulate the online survey (available in French, English and German).